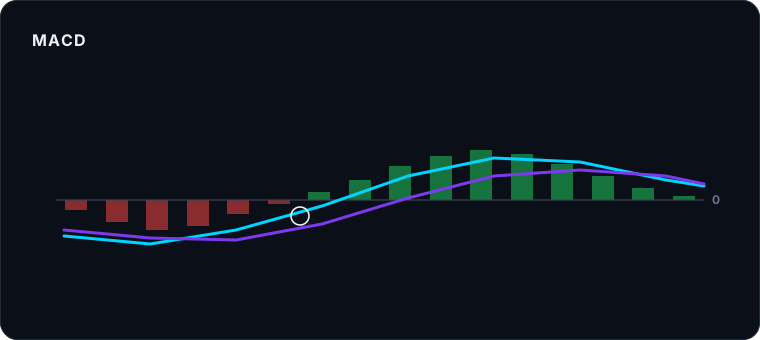
The MACD is one of the most popular indicators in technical analysis because it sums up, in a single chart, whether the strength of a trend is growing or fading. In this guide you'll see what the MACD is, its three parts and how to read its signals without falling into the usual mistakes.
What the MACD is
The MACD (Moving Average Convergence Divergence) is a momentum and trend indicator. It compares two moving averages of price to show whether market momentum is speeding up or slowing down.
The classic setup uses exponential moving averages of 12 and 26 periods, plus a 9-period average as the signal line. You don't need to calculate it by hand: what matters is knowing how to read it.
The three parts of the MACD
1. The MACD line
It is the difference between the fast average (12) and the slow one (26). When it rises, bullish momentum is growing; when it falls, it is weakening.
2. The signal line
It is a 9-period average of the MACD line itself. It acts as a reference: it smooths the indicator and produces the crossovers.
3. The histogram
These are the bars measuring the distance between the MACD line and the signal line. When the histogram grows, momentum is strengthening; when it shrinks, it is fading, even if price is still rising or falling.
How to read the MACD
- Line crossover: when the MACD line crosses above the signal line, it points to a possible rise in bullish momentum; below, the opposite.
- Zero-line crossover: if the MACD moves above zero, the fast average is above the slow one (bullish context); below, bearish context.
- Histogram: a shrinking histogram warns that the move is losing strength even before the crossover happens.
MACD divergences
As with the RSI, a divergence appears when price and the MACD do not move in the same direction. If price makes a higher high but the MACD makes a lower one, the rally is losing internal strength. It is a hint, not a certainty. The concept is explained in detail in our guide on how to read the RSI.
Common mistakes with the MACD
- Trading every crossover without looking at the trend: in a sideways market the MACD produces many false signals.
- Forgetting it lags: the MACD is based on averages, so it reacts late to sharp turns.
- Using it alone: it works best combined with price reading and other indicators.
- Changing the parameters without testing: before modifying the 12/26/9, it is worth doing backtesting.
Disclaimer: the MACD is a tool to study price momentum, not a guaranteed buy or sell signal. Trading carries a high risk of loss. This content is educational and does not constitute financial advice.
Study the MACD in context
SuperRobot AI Pro calculates the MACD alongside the RSI, the ATR and more indicators in the cloud, so you learn to read them on real data.
Start your 7-day trial