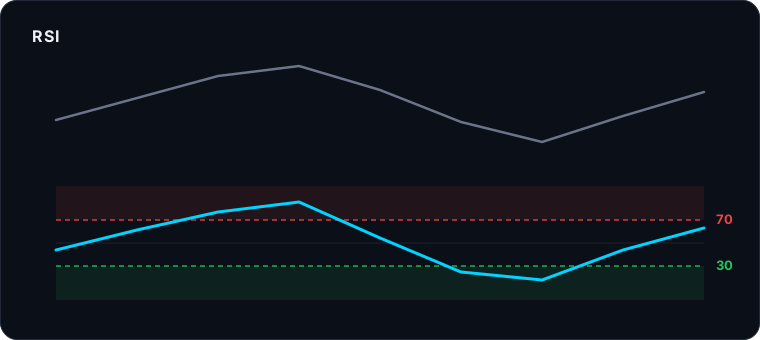
The RSI is one of the most widely used indicators in technical analysis and, also, one of the most misread. In this guide you'll see how to read the RSI correctly: what it measures, how to interpret overbought and oversold, what divergences are and the mistakes almost every beginner makes.
What the RSI is
The RSI (Relative Strength Index) is a momentum indicator created by J. Welles Wilder. It measures the speed and magnitude of recent price moves on a scale of 0 to 100.
Its goal is not to tell you to buy or sell, but to signal whether an asset has moved too fast in one direction and may be losing strength. By default it is calculated over a 14-candle period.
How to read the RSI
The basic reading uses two reference levels:
- RSI above 70: overbought zone. Price has risen strongly and the move may be running out of steam.
- RSI below 30: oversold zone. Price has fallen strongly and selling pressure may be exhausting.
- RSI around 50: balance between buyers and sellers.
Mistake #1: treating 70 and 30 as automatic signals
An RSI reading of 75 does not mean "sell now". In a strong uptrend the RSI can stay overbought for weeks while price keeps rising. Anyone who sells just because the RSI crossed 70 usually exits far too early.
Overbought and oversold are context warnings, not orders. They mean "pay attention", not "act now".
Divergences: the RSI's most useful signal
A divergence happens when price and the RSI move in opposite directions. It is the reading that gives the most information:
Bearish divergence
Price makes a higher high, but the RSI makes a lower high. It suggests the rally is losing internal strength even though price still climbs.
Bullish divergence
Price makes a lower low, but the RSI makes a higher low. It suggests the decline is running out of selling pressure.
A divergence is not a guarantee: it is a hint that the move may be weakening. It is best confirmed with other elements of the chart.
The RSI in a trend: adjust the levels
The 70/30 levels are a generic starting point. In practice:
- In an uptrend, the RSI tends to bounce in the 40-50 area instead of falling to 30.
- In a downtrend, it tends to hit resistance in the 50-60 area instead of reaching 70.
That's why many analysts use 80/20 in very volatile markets, or adapt the levels to the specific asset.
Common mistakes when using the RSI
- Trading on the RSI alone, without looking at the trend or the price context.
- Confusing overbought with "top": an overbought asset can keep rising for a long time.
- Ignoring the timeframe: the RSI on a 5-minute chart and on a daily chart tell different stories.
- Seeing divergences where there are none: if the highs/lows being compared are not clear, it is not a valid divergence.
Disclaimer: no indicator is right every time. The RSI is a tool to study price momentum, not a guaranteed buy or sell signal. This content is educational and does not constitute financial advice.
Study the RSI on real data
SuperRobot AI Pro calculates the RSI, MACD, ATR and more indicators in the cloud so you learn to read them in context.
Start your 7-day trial