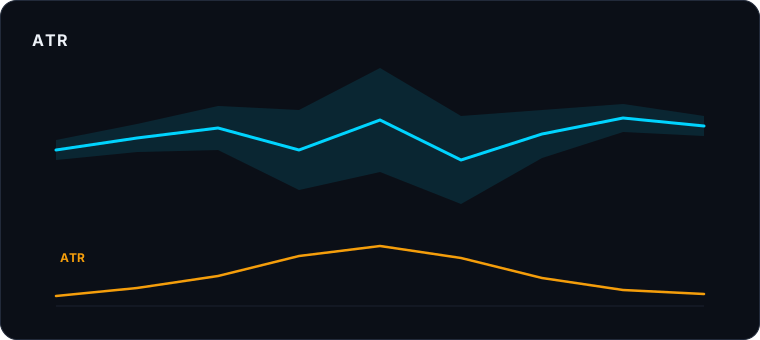
The ATR is an unflashy but very useful indicator: it doesn't tell you where price is going, but how much it moves. And that is key to managing risk. In this guide you'll see what the ATR is, what it measures and how to use it to set your stop loss and the size of your positions.
What the ATR is
The ATR (Average True Range) is a volatility indicator created by J. Welles Wilder. It measures, in the asset's own units (euros, dollars, points), how much it moves on average per candle.
A high ATR means the asset moves a lot; a low ATR means it is calm. It does not indicate direction: a high ATR can occur both in a violent rally and in a sharp fall.
How it is calculated (briefly)
The ATR starts from the "true range" of each candle, which is the largest of these three values: the distance between the candle's high and low, the distance between the high and the previous close, and the distance between the low and the previous close. The ATR is the average of that true range, usually over the last 14 periods. You don't need to calculate it by hand: any platform displays it.
The ATR measures volatility, not direction
This is the point that confuses beginners the most. The ATR is not a buy or sell signal. Its value is to tell you the "normal size" of an asset's move, so your risk decisions match the reality of that market.
How to use the ATR for the stop loss
Placing the stop loss at a fixed distance (for example, always 2%) ignores the fact that every asset moves differently. The ATR solves this:
- If an asset has a daily ATR of €3, a stop €1 away from the entry is too tight: normal price noise will knock you out straight away.
- A common practice is to place the stop at a multiple of the ATR (for example, 1.5 or 2 times the ATR) below the entry on a buy.
That way the stop breathes with the asset's real volatility instead of with an arbitrary number.
The ATR and position size
If you decide to risk a fixed amount per trade, the ATR helps you work out how many units to buy: the higher the ATR (more volatility), the smaller the position size, so the potential loss to the stop stays the same. It is a simple way not to over-risk on the most nervous assets.
Common mistakes with the ATR
- Reading it as a directional signal: the ATR does not anticipate rises or falls.
- Comparing the ATR across different assets: the ATR is in the asset's units; an ATR of 5 does not mean the same on a €20 stock as on a €2,000 one.
- Ignoring the timeframe: the ATR on a 5-minute chart and on a daily chart are different magnitudes.
- Forgetting that it changes: volatility rises and falls; it is worth reviewing the ATR rather than setting it once.
Disclaimer: the ATR is a tool to study volatility and support risk management, not a guarantee. Trading carries a high risk of loss. This content is educational and does not constitute financial advice.
Measure volatility without manual calculations
SuperRobot AI Pro calculates the ATR alongside the RSI, the MACD and more indicators in the cloud, so you can study risk management on real data.
Start your 7-day trial