Backtesting is one of the first tools anyone serious about learning technical analysis should understand. Before risking a single euro, it lets you check whether a trading idea makes sense. In this guide you'll see what backtesting is, what it is for, how to do it step by step and which mistakes to avoid.
What backtesting is, exactly
Backtesting means applying a trading strategy to historical market data to see how it would have behaved in the past. Instead of risking real money to try out a new idea, you simulate that idea over prices that already happened and measure the result.
A simple example: imagine your strategy says "buy when the RSI drops below 30 and sell when it rises above 70". A backtest walks through the last months or years of an asset, marks every moment the rule would have triggered, and calculates the cumulative result of all those trades.
What backtesting is for
- Validating an idea before risking real capital.
- Understanding the behaviour of a strategy: how often it wins, how much it loses and what losing streaks it has.
- Comparing variants objectively: does it work better with the RSI at 30 or at 25?
- Building discipline: it forces you to define concrete rules instead of trading on intuition.
What backtesting does not do is predict the future. A good result in the past does not guarantee a good result tomorrow; it only tells you the idea was not absurd.
How to run a backtest step by step
1. Define clear, objective rules
Entry, exit, stop loss and position size must be defined without ambiguity. If a rule depends on your "gut feeling", it cannot be tested.
2. Choose the asset and the period
Use several years of data and, ideally, different market phases: uptrends, downtrends and sideways markets. A strategy tested only during a big rally will look flawless when it is not.
3. Walk through the data and log every trade
Record each entry and exit with its result. This is where an automated tool saves hours compared to manual calculation.
4. Include the real costs
Commissions and slippage (the gap between the expected price and the executed one) change the result. A strategy that is profitable "gross" can be a loser once you subtract costs.
5. Measure the results with metrics
Don't stop at "it won or it lost". Move on to the metrics below.
Key metrics you should look at
- Total return and average return per trade.
- Win rate (percentage of winning trades). Careful: a high win rate doesn't mean the strategy is profitable if the losses are large.
- Reward/risk ratio: how much you win on average versus how much you lose.
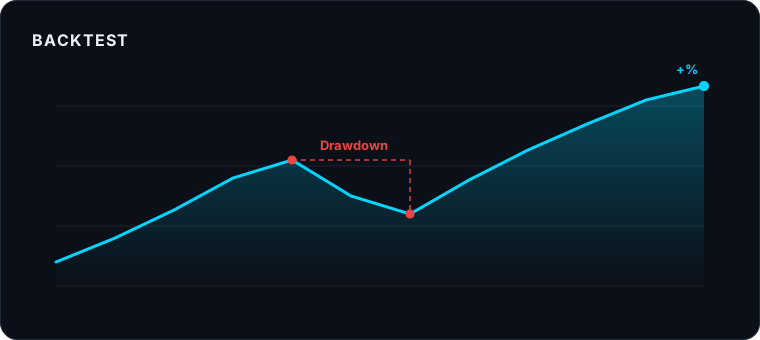
- Maximum drawdown: the largest drop from a peak. It measures how much "pain" you would have had to endure.
- Number of trades: with very few trades, the result is not statistically reliable.
Common backtesting mistakes
- Overfitting: tuning the parameters so tightly to the historical data that the strategy only works on that exact stretch.
- Ignoring commissions and slippage.
- Survivorship bias: testing only assets that still exist today, forgetting the ones that went bankrupt.
- Lookahead bias: using information in the simulation that was not yet available at that moment.
- Samples that are too small: too few trades or too short a period.
Backtesting versus real results
A backtest is a starting point, not a guarantee. The market changes, real execution has delays and the psychology of trading with real money does not show up in a simulation. That's why, after a reasonable backtest, the logical next step is paper trading (simulating in real time with no money) and only then, small real capital.
Disclaimer: trading carries a high risk of loss. Backtesting is a study tool and does not ensure future results. This content is educational and does not constitute financial advice.
Try backtesting without the hassle
SuperRobot AI Pro includes historical backtesting and indicators in the cloud, designed to learn technical analysis in a structured way.
Start your 7-day trial