When you start out in technical analysis it is easy to feel overwhelmed: there are dozens of indicators and they all seem essential. The reality is that with five well-understood indicators you have more than enough to begin. In this guide you'll see which ones they are, what each measures and how to combine them without cluttering the chart.
What a technical indicator is
A technical indicator is a mathematical calculation based on an asset's price and/or volume, plotted on the chart to help you interpret what is happening. It is not a crystal ball: it organises information that is already in the price so you can see it more clearly.
Indicators broadly fall into four families: trend, momentum, volatility and volume. A good starting point is to pick one from each family rather than piling up five of the same kind.
The 5 essential indicators to start with
1. Moving averages (trend)
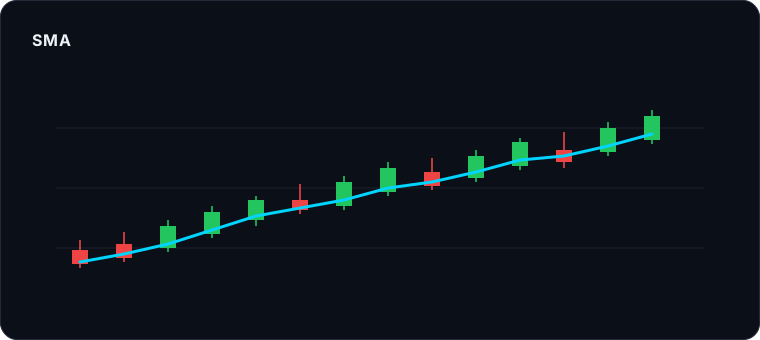
A moving average smooths price to show the general direction. If price is above a 200-period average, the context is bullish; below it, bearish. The cross of a short average over a long one is one of the most classic trend signals.
2. RSI (momentum)
The RSI measures the strength and speed of a move on a 0-100 scale. It helps you see whether an asset has moved too fast and may be losing momentum. To go deeper, see our full guide on how to read the RSI.
3. MACD (momentum and trend)
The MACD (Moving Average Convergence Divergence) combines two moving averages to show momentum changes. When its main line crosses the signal line, it points to a possible shift in the strength of the move. It is useful to confirm what you see with moving averages.
4. ATR (volatility)
The ATR (Average True Range) does not tell you direction, but how much an asset moves on average. It is very useful for sizing stops and positions: in a more volatile asset you need to give the stop loss more room so you are not knocked out by noise.
5. Volume
Volume measures how many trades are executed. A price move accompanied by high volume has more backing than one on low volume. Volume mainly serves to confirm what the other indicators suggest.
How to combine them without cluttering the chart
The most common beginner mistake is filling the chart with indicators until the price is no longer visible. Some practical rules:
- One per family. A moving average (trend), the RSI or MACD (momentum), the ATR (volatility) and volume. That's enough.
- Let them confirm each other. A signal is worth more when two independent indicators point to the same thing.
- Price rules. Indicators derive from price; they never replace it.
- Same timeframe, same story. Decide whether you analyse on a daily chart, 1-hour, etc., and be consistent.
Common mistakes with indicators
- Stacking indicators that measure the same thing (two momentum oscillators give you no new information).
- Looking for the "magic" indicator: it does not exist. None is right every time.
- Treating every cross as an order without looking at the market context.
- Not testing the rules before using them. This is where backtesting comes in: testing the idea on historical data before risking capital.
Disclaimer: indicators are study tools, not guaranteed buy or sell signals. Trading carries a high risk of loss. This content is educational and does not constitute financial advice.
Practise with all 5 indicators in one place
SuperRobot AI Pro brings together moving averages, RSI, MACD, ATR and more in a cloud platform built for learning.
Start your 7-day trial